Building A Microservice Chassis With Spring Boot and Spring Cloud
Starting development on a new application or service often results in repeating the same work to implement common concerns. The build system, runtime container, security, monitoring, logging, tracing, etc are all cross-cutting concerns that each of your services should ideally implement in a similar fashion. Just as we try to keep our code pragmatically DRY (don’t repeat yourself), we also want to apply the same principal to our application infrastructures.
A microservice chassis is one such way to implement these cross-cutting concerns. Building a reusable chassis can help save time, enforce consistency across teams, and ensure that each service shares the same operational charateristics. In this article I’ll outline a production-ready chassis using Spring Boot and Spring Cloud that you can use to bootstrap your own cloud applications.
Microservices
Ok, I’ll be honest… when I hear the term “microservices” I start to get a glazed look on my face. Just like the famous “MongoDB is Web Scale” cartoon, microservices are often touted as the only true way to implement an enterprise architecture. Of course, pragmatically your architecture may be better served by a clustered monolith. Or perhaps a collection of clustered “mini” services. Or maybe your team has the devops and architectural ability to properly implement and operate a microservices architecture. Or perhaps some combination of the above. While determining the granularity of your service footprint is an important up-front decision, it also should be adjustable over time. The important thing is to keep things as decoupled as possible.
Regardless of your decision regarding service granularity, you still have to address a common set of concerns up front. There may be additional unique concerns for your architecture, but these common areas are the ones that I’ll be addressing in this article:
- Build System
- Logging
- Monitoring
- Distributed Tracing
- Service Discovery
- Runtime Container
The Chassis
Our chassis is comprised of the following frameworks and components:
| Framework/Component | Purpose |
|---|---|
| Spring Boot | Core framework |
| Spring Boot Actuator + Spring Boot Admin | Runtime monitoring |
| Spring Cloud Netflix (Eureka) | Service registration and discovery |
| Spring Cloud Sleuth + Zipkin | Distributed call tracing |
| slf4j and Logback | Logging |
| Gradle | Build system |
| Docker | Optional runtime container |
We’ll dig into each of these areas in the following sections.
Build System
Our build system is based on Gradle. It has the responsiblity for compiling, packaging, versioning, and resolving all of our 3rd party dependencies.
For those who would rather just get right to it, I’ll start by presenting the entire build.gradle file. We’ll drill down into the details later.
build.gradle
buildscript {
    repositories {
        jcenter()
    }
    dependencies {
        // The gradle-docker plugin we want to use isn't yet in gradle plugin portal, so we
        // pull it from jcenter
        classpath 'se.transmode.gradle:gradle-docker:1.2'
    }
}

plugins {
    // Use the Spring Boot Gradle plugin, which automatically applies the dependency management plugin
    // and configures it to import the spring-boot-starter-parent bom.
    id 'org.springframework.boot' version '1.5.10.RELEASE'

    // Versioning plugin
    id 'pl.allegro.tech.build.axion-release' version '1.8.1'
}

// The Java plugin allows us to compile and package our code into a jar file
apply plugin: 'java'

// Support for packaging our application as a Docker image
apply plugin: 'docker'

// Define the namespace for our build artifacts (replace with your own group)
group 'atc'

// Explicitly declare that we're using JDK 1.8
sourceCompatibility = 1.8

// Use Maven Central to resolve all 3rd party dependencies
repositories {
    mavenCentral()
}

// Using the dependency management plugin, import the dependencies for
// Spring Cloud release train 'Edgware.SR2'
dependencyManagement {
    imports {
        mavenBom 'org.springframework.cloud:spring-cloud-dependencies:Edgware.SR2'
    }
}

dependencies {
    // Enable Spring MVC
    compile group: 'org.springframework.boot', name: 'spring-boot-starter-web'

    // Enable Spring Security
    compile group: 'org.springframework.boot', name: 'spring-boot-starter-security'

    // Production metrics for Spring Boot
    compile group: 'org.springframework.boot', name: 'spring-boot-starter-actuator'

    // Service registration via Eureka
    compile group: 'org.springframework.cloud', name: 'spring-cloud-starter-eureka-server'

    // Enable distributed tracing with Sleuth
    compile group: 'org.springframework.cloud', name: 'spring-cloud-starter-zipkin'

    // Enable JSON logging
    runtime( group: 'net.logstash.logback', name: 'logstash-logback-encoder', version: '4.11' ) {
        exclude group: 'ch.qos.logback', module: 'logback-core'
    }

    testCompile group: 'junit', name: 'junit', version: '4.12'
}

// Configure the spring boot executable jar
springBoot {
    executable = true
    buildInfo()
}

// Versioning with the Axion release plugin
scmVersion {
    // Treat uncommitted changes as trigger for version increment
    ignoreUncommittedChanges = false

    // All versions will start with "v"
    tag {
        prefix = 'v'
        versionSeparator = ''
    }

    // Our versioning scheme is major.minor.rcX. If we're on a branch named "release/*", increment the release
    // candidate number, otherwise increment the minor version number.
    versionIncrementer 'incrementMinorIfNotOnRelease', [releaseBranchPattern: 'release.*']
    branchVersionIncrementer = [
          'master'    : 'incrementMinor',
          'feature'   : 'incrementMinor',
          'release/.*': 'incrementPrerelease'
    ]

    // Decorators
    versionCreator 'simple'
    branchVersionCreator = [
          'feature/.*': 'versionWithBranch'
    ]

    checks {
        // Allow for releasing a new version if there are uncommitted changes
        uncommittedChanges = false
    }
}
project.version = scmVersion.version

// Add the version number to the manifest
jar {
    manifest {
        attributes( "Implementation-Title": project.name,
                    "Implementation-Version": project.version.toString() )
    }
}


// Build the docker container for this application
task buildDocker( type: Docker, dependsOn: build ) {
    push = false
    applicationName = rootProject.name
    dockerfile = file( 'Dockerfile' )

    doFirst {
        // Rename the app jar to "app.jar" so that the Dockerfile does not require renames
        copy {
            from "${project.buildDir}/libs"
            into stageDir
            include "${rootProject.name}-${version}.jar"
            rename( "${rootProject.name}-${version}.jar", "app.jar" )
        }
    }
}


// Configure the Gradle wrapper
task wrapper( type: Wrapper ) {
    gradleVersion = '4.5.1'
}
Let’s start by looking at the build-specific behaviors.
Versioning
For versioning we will be using the excellent Axion gradle plugin. This will allow us to maintain unique version numbers by leveraging git tags. Basically it stores the version number as a git tag, and has various tasks that can be used to manage the version.
You can view the current version by running ./gradlew currentVerion, or ./gradlew cV for short.
To increment the version number, simply run ./gradlew release.
To force a non-sequential version number, run ./gradlew markNextVersion -Prelease.version=1.0.0.
That’s it! I’ve provided a default configuration (scmVersion) in the above build.gradle which will increment the minor release number unless you’re on a branch whose name starts with release/, in which case the .rcX number will be incremented. This is suitable for a git workflow similar to this one.
Dependency Management
The Spring Boot gradle plugin also includes the dependency management plugin. This lets us import a maven bom which in turn allows us to omit version numbers from the dependencies managed by the bom.
For example, we want to use the Edgware.SR2 Spring Cloud release train. We do so by importing the bom as shown below.
// Using the dependency management plugin, import the dependencies for
// Spring Cloud release train 'Edgware.SR2'
dependencyManagement {
    imports {
        mavenBom 'org.springframework.cloud:spring-cloud-dependencies:Edgware.SR2'
    }
}
Now we can define our Spring Cloud dependencies without needing to specify a version number.
dependencies {
    ...
    // Service registration via Eureka
    compile group: 'org.springframework.cloud', name: 'spring-cloud-starter-eureka-server'
    ...
}
Gradle Wrapper
The gradle wrapper gives you the ability to generate a pre-built script which will self-bootstrap gradle onto local workstations. This means that developers working on the project won’t need to manage their own Gradle installations.
To use the wrapper, simply add the following task to your build.gradle file:
// Configure the Gradle wrapper
task wrapper( type: Wrapper ) {
    gradleVersion = '4.5.1'
}
The first time you generate the wrapper, you need to install a local copy of gradle. Run $GRADLE_HOME/bin/gradle wrapper to generate the wrapper scripts which you can check into your version control system. Check in the resulting gradlew and gradlew.bat scripts, as well as the gradle/ directory.
After that, anyone can simply clone the repo and run ./gradlew or gradlew.bat without needing to manually install gradle!
Service Registration And Discovery
Within a cloud environment we need to expect service instances to come and go. As such, we need some mechanism to locate these instances.
In AWS I’ve often relied on ELBs to act as the service registry. This is known as server-side discovery. This works well if you’re using native AWS services such as Elastic Container Service.
An alternative pattern is client-side discovery. In this model, clients ask a service registry for the location of service instances, and handle load balancing themselves. This avoids having to pay for a bunch of AWS ELBs, instead you just need to operate an HA service registry. For our microservice chassis we’ll be implementing this pattern using Eureka as our service registry.
Eureka Client
In order for our application to register with Eureka, we need to do a few things.
First, import the Eureka dependency in your build.gradle file:
// Service registration via Eureka
compile group: 'org.springframework.cloud', name: 'spring-cloud-starter-eureka-server'
Then add the @EnableDiscoveryClient annotation to your main Spring Boot application class:
@EnableDiscoveryClient
@SpringBootApplication
public class Application
{
    public static void main ( final String[] args )
    {
        SpringApplication.run( Application.class, args );
    }
}
Finally, tell Spring Boot where to find the Eureka server(s) by adding the following to your application.yml:
eureka:
  client:
    serviceUrl:
      default: http://localhost:8761/eureka/
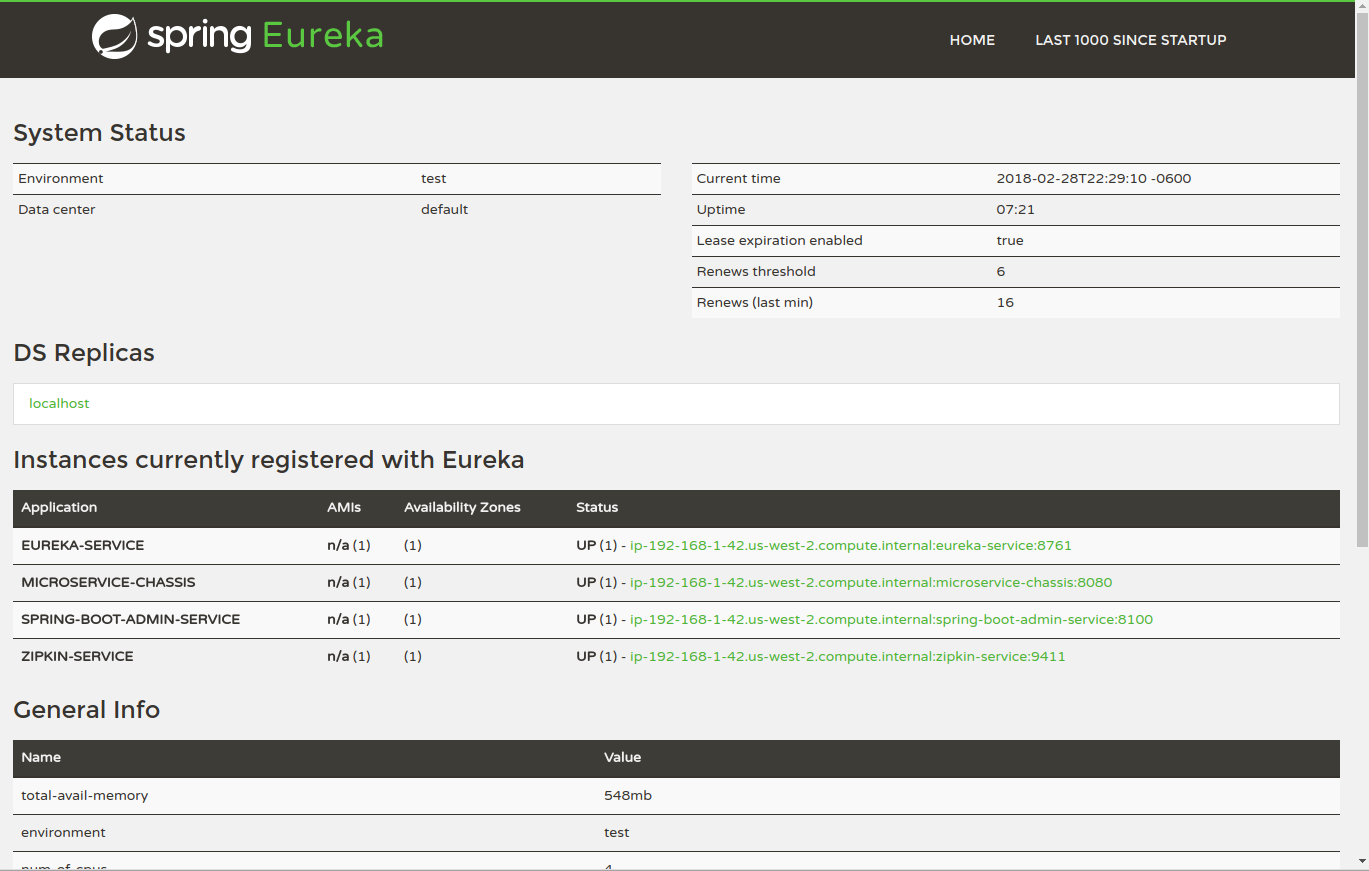
Eureka Server
Standing up a single node Eureka server is quite simple. Using a standalone Spring Boot application, simply apply the @EnableEurekaServer annotation to your main application class. I’ve provided the code to do so here:
https://github.com/darrylanderson/spring-boot-eureka-service
Simply clone this repo, and then run ./gradlew bootRun to start up a Eureka server listening on port 8761.
The Eureka server configuration I’ve presented is not suitable for a highly-available production infrastructure. In production you should run it across availability zones in a clustered configuration. I hope in the future to take a deeper dive into how to make Eureka production ready, but in the meantime take a look at this excellent article on running Eureka in a production environment: https://blog.asarkar.org/technical/netflix-eureka/.
Logging
You have a lot of choices for logging frameworks in Java. Log4j, Logj42, java.util.logging, Commons Logging, Logback, and slf4j, the choice can be confusing.
I almost always opt for using slf4j to abstract away the underlying log framework from the codebase, and either log4j2 or logback as the logging framework. In this case we’ll be using logback, for no other reason than it’s slightly easier to set up from a dependency perspective (log4j2 requires a few more dependencies).
Configuring logback is done through a file logback-spring.xml in src/main/resources. We want to have the following logging characteristics:
- Log to the console.
- Log to a file in a folder defined by the
$LOG_PATHvariable, defaulting to /tmp. - Optionally log json logs to a file, for consumption by tools such as logstash.
- For all log files, roll over every night, keeping a maximum of 90 days worth of log files.
Here’s a copy of the configuration we’ll use in our chassis. I’ve tried to comment the file as much as possible so you can see what’s going on.
src/main/resurces/logback-spring.xml
<?xml version="1.0" encoding="UTF-8"?>
<configuration>
<include resource="org/springframework/boot/logging/logback/defaults.xml"/>
<springProperty scope="context" name="springAppName" source="spring.application.name"/>
<!-- Example for logging into a 'logs' folder -->
<property name="LOG_FILE" value="${LOG_FILE:-${LOG_PATH:-${LOG_TEMP:-${java.io.tmpdir:-/tmp}}}}/${springAppName}.log"/>
<!-- You can override this to have a custom pattern -->
<property name="CONSOLE_LOG_PATTERN"
value="%clr(%d{yyyy-MM-dd HH:mm:ss.SSS}){faint} %clr(${LOG_LEVEL_PATTERN:-%5p})
%clr(${PID:- }){magenta} %clr(---){faint} %clr([%15.15t]){faint} %clr(%-40.40logger{39}){cyan}
%clr(:){faint} %m%n${LOG_EXCEPTION_CONVERSION_WORD:-%wEx}"/>
<!-- Appender to log to console -->
<appender name="console" class="ch.qos.logback.core.ConsoleAppender">
<filter class="ch.qos.logback.classic.filter.ThresholdFilter">
<!-- Minimum logging level to be presented in the console logs-->
<level>DEBUG</level>
</filter>
<encoder>
<pattern>${CONSOLE_LOG_PATTERN}</pattern>
<charset>utf8</charset>
</encoder>
</appender>
<!-- Appender to log to file -->
<appender name="flatfile" class="ch.qos.logback.core.rolling.RollingFileAppender">
<file>${LOG_FILE}</file>
<!-- Daily rollovers, keep a maximum of 90 log files -->
<rollingPolicy class="ch.qos.logback.core.rolling.TimeBasedRollingPolicy">
<fileNamePattern>${LOG_FILE}.%d{yyyy-MM-dd}.gz</fileNamePattern>
<maxHistory>90</maxHistory>
</rollingPolicy>
<encoder>
<pattern>${CONSOLE_LOG_PATTERN}</pattern>
<charset>utf8</charset>
</encoder>
</appender>
<!-- Appender to log to file in a JSON format -->
<appender name="logstash" class="ch.qos.logback.core.rolling.RollingFileAppender">
<file>${LOG_FILE}.json</file>
<!-- Daily rollovers, keep a maximum of 90 log files -->
<rollingPolicy class="ch.qos.logback.core.rolling.TimeBasedRollingPolicy">
<fileNamePattern>${LOG_FILE}.json.%d{yyyy-MM-dd}.gz</fileNamePattern>
<maxHistory>90</maxHistory>
</rollingPolicy>
<encoder class="net.logstash.logback.encoder.LoggingEventCompositeJsonEncoder">
<providers>
<timestamp>
<timeZone>UTC</timeZone>
</timestamp>
<pattern>
<pattern>
{
"severity": "%level",
"service": "${springAppName:-}",
"trace": "%X{X-B3-TraceId:-}",
"span": "%X{X-B3-SpanId:-}",
"parent": "%X{X-B3-ParentSpanId:-}",
"exportable": "%X{X-Span-Export:-}",
"pid": "${PID:-}",
"thread": "%thread",
"class": "%logger{40}",
"rest": "%message"
}
</pattern>
</pattern>
</providers>
</encoder>
</appender>
<root level="INFO">
<appender-ref ref="console"/>
<appender-ref ref="flatfile"/>
<!-- uncomment this to have also JSON logs -->
<!--<appender-ref ref="logstash"/>-->
</root>
</configuration>
Tracing
An often overlooked concern is how to log distributed calls across multiple services. If not addressed early, it can lead to a difficult manual effort of correlating logs based on timestamps to recreate an entire call flow.
Fortunately Spring Cloud has a great solution for us. With a combination of Spring Cloud Sleuth as well as Zipkin we can gain visibility into distributed call traces.
Spring Cloud Sleuth
Spring Cloud Sleuth will populate log entries with trace information as well as pass it to downstream services via request headers. This allows us to correlate log entries to view a complete distributed call trace.
To start instrumenting your logs, add the following dependencies to build.gradle:
// Enable distributed tracing with Sleuth
compile group: 'org.springframework.cloud', name: 'spring-cloud-starter-zipkin'

// Enable JSON logging
runtime( group: 'net.logstash.logback', name: 'logstash-logback-encoder', version: '4.11' ) {
    exclude group: 'ch.qos.logback', module: 'logback-core'
}
Since we’re using slf4j we don’t need to do anything further to get trace information to show up in our logs. But if you’re using something different, you need to add the following to your logging pattern:
%5p [${spring.zipkin.service.name:${spring.application.name:-}},%X{X-B3-TraceId:-},%X{X-B3-SpanId:-},%X{X-Span-Export:-}]
Your logs will now look something like this:
2018-02-27 15:52:19.254 INFO [microservice-chassis,44b89943973cf637,44b89943973cf637,true] 15010 --- [nio-8080-exec-1] a.e.c.ServiceInstanceRestController : invoking GET /service-instances
While this is a good start, what we really need is some way to search and visualize correlated trace ids. An easy way to get started is with Zipkin.
Zipkin Server
Zipkin is a web application which ingests and visualizes log data from Spring Cloud Sleuth.
To have logs sent to a Zipkin server, add the following to your application.yml file:
spring:
  # Send distributed traces to zipkin server (using Eureka to find the server)
  sleuth:
    sampler:
      percentage: 1.0
  zipkin:
    baseUrl: http://zipkin-service/
What we’ve done is told Spring Cloud Sleuth to send 100% of our tracing logs to a Zipkin server which has registered itself Eureka as zipkin-zervice.
Now we need to stand up a Zipkin server. Fortunately this is quite simple as you only need to apply the annotation @EnableZipkinServer to a Spring Boot application. I’ve provided the code to do so here:
https://github.com/darrylanderson/spring-boot-zipkin-service
Simply clone this repo, and then run ./gradlew bootRun to start up a server listening on port 9411. It also expects a Eureka server to be running on port 8761.
Now you’ll be able to visualize distributed log traces similar to below:

Monitoring
Spring Boot applications are very easy to monitor. With a combination of JMX and Spring Boot Actuator, we have a wealth of useful instrumentation data to help monitor our applications in production.
Spring Boot Actuator
To start using Actuator, add the following dependency to build.gradle:
// Production metrics for Spring Boot
compile group: 'org.springframework.boot', name: 'spring-boot-starter-actuator'
I usually like to host the Actuator endpoints on a different port from the main web application. This allows you to secure the port at a network level. Doing this is as simple as adding the following to your application.yml:
management:
  port: 8000
  add-application-context-header: false
  security:
    # Disable security on the management port (NOT FOR PRODUCTION)
    enabled: false
Now you can request the following endpoints:
curl -XGET http://localhost:8000/health
{
  "description": "Composite Discovery Client",
  "status": "UP",
  "discoveryComposite": {
    "description": "Composite Discovery Client",
    "status": "UP",
    "discoveryClient": {
      "description": "Composite Discovery Client",
      "status": "UP",
      "services": [
        "spring-boot-admin-service",
        "eureka-service",
        "zipkin-service",
        "microservice-chassis"
      ]
    },
    "eureka": {
      "description": "Remote status from Eureka server",
      "status": "UP",
      "applications": {
        "SPRING-BOOT-ADMIN-SERVICE": 1,
        "MICROSERVICE-CHASSIS": 1,
        "EUREKA-SERVICE": 1,
        "ZIPKIN-SERVICE": 1
      }
    }
  },
  "diskSpace": {
    "status": "UP",
    "total": 159639302144,
    "free": 24657862656,
    "threshold": 10485760
  },
  "hystrix": {
    "status": "UP"
  }
}
curl -XGET http://localhost:8000/metrics
{
  "mem": 723728,
  "mem.free": 463508,
  "processors": 4,
  "instance.uptime": 1724610,
  "uptime": 1734904,
  "systemload.average": 0.68,
  "heap.committed": 632320,
  "heap.init": 256000,
  "heap.used": 168811,
  "heap": 3626496,
  "nonheap.committed": 92888,
  "nonheap.init": 2496,
  "nonheap.used": 91408,
  "nonheap": 0,
  "threads.peak": 56,
  "threads.daemon": 52,
  "threads.totalStarted": 187,
  "threads": 56,
  "classes": 11006,
  "classes.loaded": 11006,
  "classes.unloaded": 0,
  "gc.ps_scavenge.count": 13,
  "gc.ps_scavenge.time": 407,
  "gc.ps_marksweep.count": 3,
  "gc.ps_marksweep.time": 337,
  "counter.servo.eurekaclient.transport.request": 0,
...
  "httpsessions.max": -1,
  "httpsessions.active": 0
}
While these endpoints can be helpful, having some sort of administrative interface is preferable. In the next sections we’ll discuss using JMX as well as Spring Boot Admin UI for this purpose.
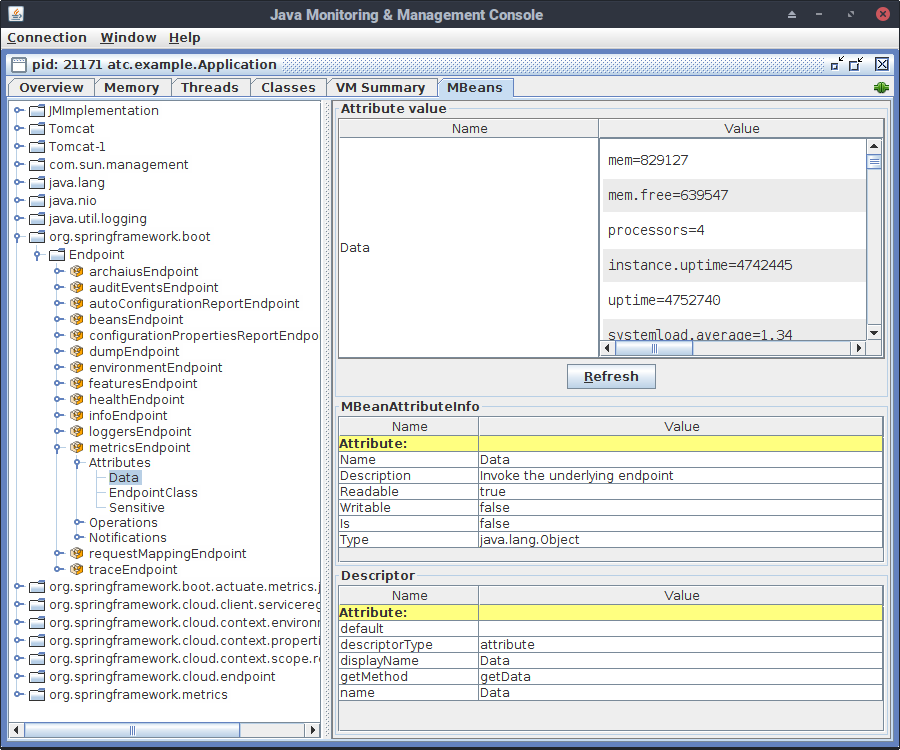
JMX
If you have JMX capabilities within your monitoring infrastructure, you may want to export actuator metrics to JMX. For example, Zabbix offers the Java Gateway as a great way to monitor a fleet of Java applications.
In order to expose actuator metrics to JMX, you need to register a specific bean. The following configuration class is all you need:
package atc.example.config.monitoring;

import org.springframework.boot.actuate.autoconfigure.ExportMetricWriter;
import org.springframework.boot.actuate.metrics.jmx.JmxMetricWriter;
import org.springframework.boot.actuate.metrics.writer.MetricWriter;
import org.springframework.context.annotation.Bean;
import org.springframework.context.annotation.Configuration;
import org.springframework.jmx.export.MBeanExporter;

@Configuration
public class MonitoringConfiguration
{
    /**
     * Export spring boot metrics to JMX.
     *
     * @param exporter
     * @return a MetricsWriter object
     */
    @Bean
    @ExportMetricWriter
    public MetricWriter metricWriter ( final MBeanExporter exporter )
    {
        return new JmxMetricWriter( exporter );
    }
}
Now you can view all of the actutor metrics via JMX.
Spring Boot Admin Server
Spring Boot Admin provides an administrative interface for our Spring Boot applications.
Since we’re using Eureka, we can use service discovery for our applications to register with the Spring Boot Admin service. The only thing we need to handle is to tell Eureka that Spring Boot Admin should contact our service using the management port rather than our main http port.
You do this by passing the management port to Eureka as metadata. The following stanza in application.yml shows how this is configured:
eureka:
  instance:
    metadataMap:
      # Support for Spring Boot Admin client discovery
      management.port: 8000
Now we need to stand up a Spring Boot Admin server. Fortunately this is quite simple as you only need a single annotation (@EnableAdminServer) applied to a Spring Boot application. I’ve provided the code to do so here:
https://github.com/darrylanderson/spring-boot-admin-service
Simply clone this repo, and then run ./gradlew bootRun to start up a server listening on port 8100. It also expects a Eureka server to be running on port 8761.


Deployment
Executable Jar
Spring Boot offers us an easy way to package up our service as an executable jar. This executable jar can be easily registered as an init.d or systemd service.
The necessary configuration in our build.gradle is as follows:
// Configure the spring boot executable jar
springBoot {
    executable = true
    buildInfo()
}
Now when we run ./gradlew build we will build an executable jar in build/libs.
To register this jar as an init.d service, simply symlink the file to /etc/init.d/. For example, sudo ln -s /var/myapp/myapp.jar /etc/init.d/myapp.
If you’re using systemd, you need to create a service script in /etc/systemd/system:
[Unit]
Description=myapp
After=syslog.target

[Service]
User=myapp
ExecStart=/var/myapp/myapp.jar
SuccessExitStatus=143

[Install]
WantedBy=multi-user.target
Docker
We can also package our application as a Docker image. To do so we’ll use the Transmode gradle docker plugin.
I’ll take a deep dive into Docker based architectures in future articles, but for now I’ll simply present how to create the Docker image.
The necessary configuration in build.gradle is as follows:
buildscript {
    repositories {
        jcenter()
    }
    dependencies {
        // The gradle-docker plugin we want to use isn't yet in gradle plugin portal, se we
        // pull it from jcenter
        classpath 'se.transmode.gradle:gradle-docker:1.2'
    }
}

...

// Support for packaging our application as a Docker image
apply plugin: 'docker'

...

// Build the docker container for this application
task buildDocker( type: Docker, dependsOn: build ) {
    push = false
    applicationName = rootProject.name
    dockerfile = file( 'Dockerfile' )

    doFirst {
        // Rename the app jar to "app.jar" so that the Dockerfile does not require renames
        copy {
            from "${project.buildDir}/libs"
            into stageDir
            include "${rootProject.name}-${version}.jar"
            rename( "${rootProject.name}-${version}.jar", "app.jar" )
        }
    }
}
While not strictly necessary, we’ll use an external Dockerfile. This is to support other tooling.
FROM anapsix/alpine-java:8_server-jre_unlimited
VOLUME /tmp
ADD app.jar app.jar
ENV JAVA_OPTS=""
ENTRYPOINT [ "sh", "-c", "java $JAVA_OPTS -Djava.security.egd=file:/dev/./urandom -jar /app.jar" ]
To produce the docker image, simply run:
./gradlew buildDocker
Wrapping Up
To recap, here are the github repos containing the code in this article:
Having a microservice chassis can be a huge time saver when starting development on a new service. I hope that you’ll find this chassis useful in your own development efforts.
Also published on DZone.